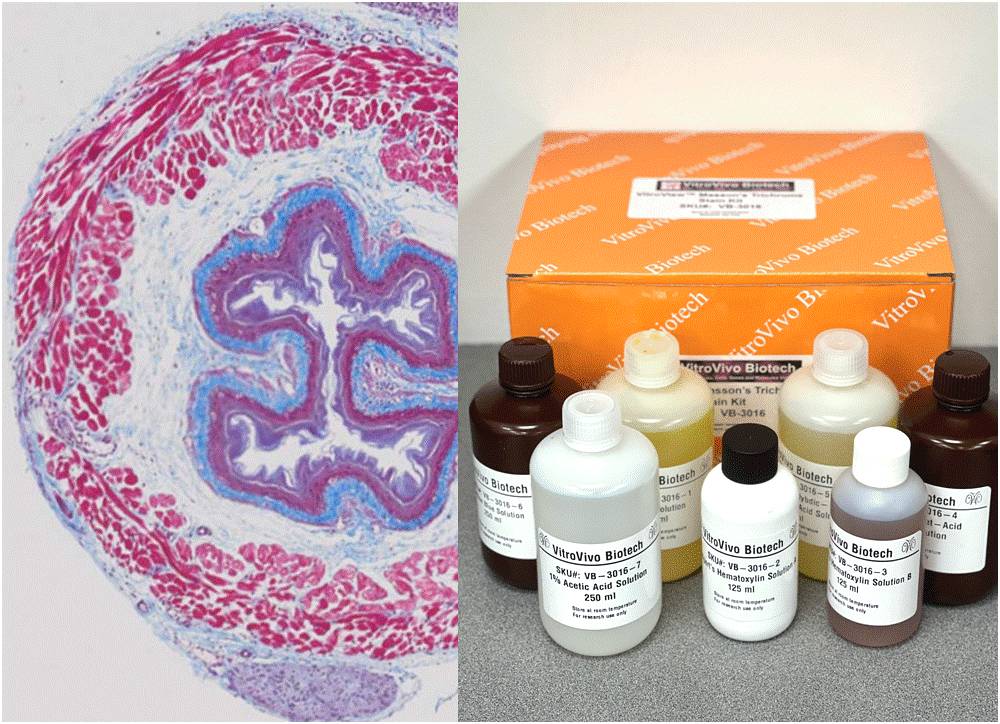
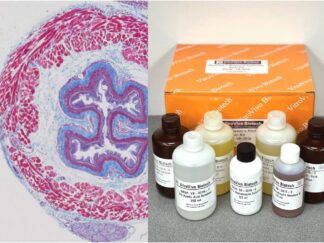
Masson’s Trichrome Stain Kit is used to differentiate between collagen and smooth muscle in tumors, and the increase of collagen in diseases such as cirrhosis. It is a routine stain for liver and kidney biopsies. This kit can be used for FFPE and frozen tissue slides.
Kit Introduction Video
Kit Contents
VB-3016-1 Bouin’s solution———————————————————250 ml
VB-3016-2 Weigert’s Hematoxylin Solution A——————————125 ml
VB-3016-3 Weigert’s Hematoxylin Solution B——————————125 ml
VB-3016-4 Biebrich Scarlet-Acid Fuchsin Solution———————–250 ml
VB-3016-5 Phosphomolybdic-Phosphotungstic Acid Solution —250 ml
VB-3016-6 Aniline Blue Solution————————————————-250 ml
VB-3016-7 1% Acetic Acid Solution———————————————250 ml
Protocol
For formalin-fixed, paraffin-embedded (FFPE) tissue sections:
Deparaffinize in Xylene I for 6 minutes and II for 6 minutes.
Rehydrate: ethanol 100% (2 minutes)x2; ethanol 95% (2 minutes)x2; ethanol 70% (2 minutes)x1; Rinse in distilled water (5 minutes).Mordant in Bouin’s Solution, 60°C for 1 hour.
Prepare Weigert’s working hematoxylin: mix Weigert’s Hematoxylin Solution A and B at 1:1 ratio.
Weigert’s working hematoxylin for 10 minutes. (Note: Discard after use.)
Blue in running tap water for 5 minutes, rinse once for 1 min in distilled water.
Biebrich Scarlet-Acid Fuchsin Solution for 5 minutes. (Note: Solution may be used twice only, then discarded.)
Rinse once for 1 min in distilled water.
Phosphotungstic/phosphomolybdic acid solution for 10 minutes, discard solution.
Transfer directly into Aniline Blue Solution for 10 minutes.
Rinse once for 2-3 seconds in distilled water.
Acetic Acid Solution for 2-3 seconds, discards solution.
Dehydrate with 2 changes of 95% Ethanol and 2 changes of 100% Ethanol (2 minute per change).
Clear with 3 changes of xylene (5 minutes per change) and coverslip with Permount or other suitable organic mounting medium.
For Frozen Sections:
Fix frozen sections in 10% formalin (not Zinc) for 30 minutes.
Rinses in distilled water 3×3min.
Mordant in Bouin’s Solution, 60°C for 1 hour.
Wash in running tap water for 5 minutes to remove the picric acid.
Weigert’s working hematoxylin for 7 minutes. (Note: Discard after use.)
Blue in running tap water for 5 minutes, rinse in distilled water.
Biebrich Scarlet-Acid Fuchsin Solution for 5 minutes. (Note: Solution may be used twice only, then discarded.)
Rinse in distilled water.
Phosphotungstic/phosphomolybdic Acid Solution for 10 minutes, discard solution.
Transfer directly into Aniline Blue Solution for 5 minutes.
Rinse once for 2-3 seconds in distilled water.
1% Acetic acid for 2-3 seconds , discard solution.
Dehydrate with 2 dip of 95% Ethanol and 2 changes of 100% Ethanol (2 minutes per change).
Clear with 3 changes of xylene (5 minutes per change) and coverslip with Permount or other suitable organic mounting medium.
Expected results
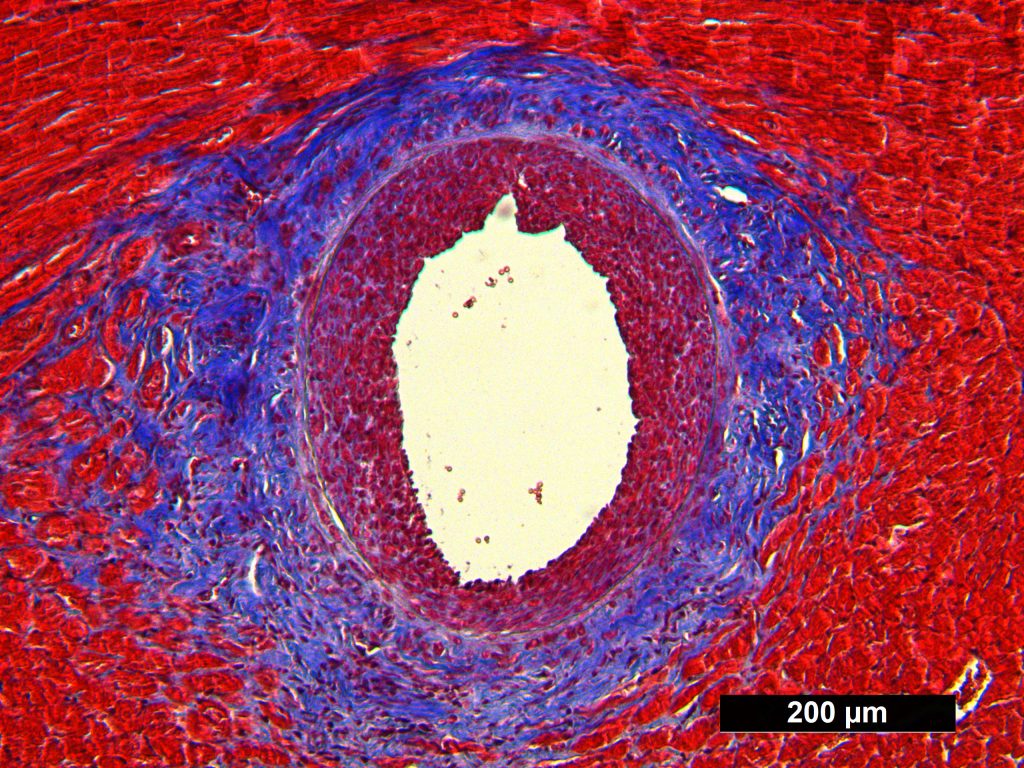
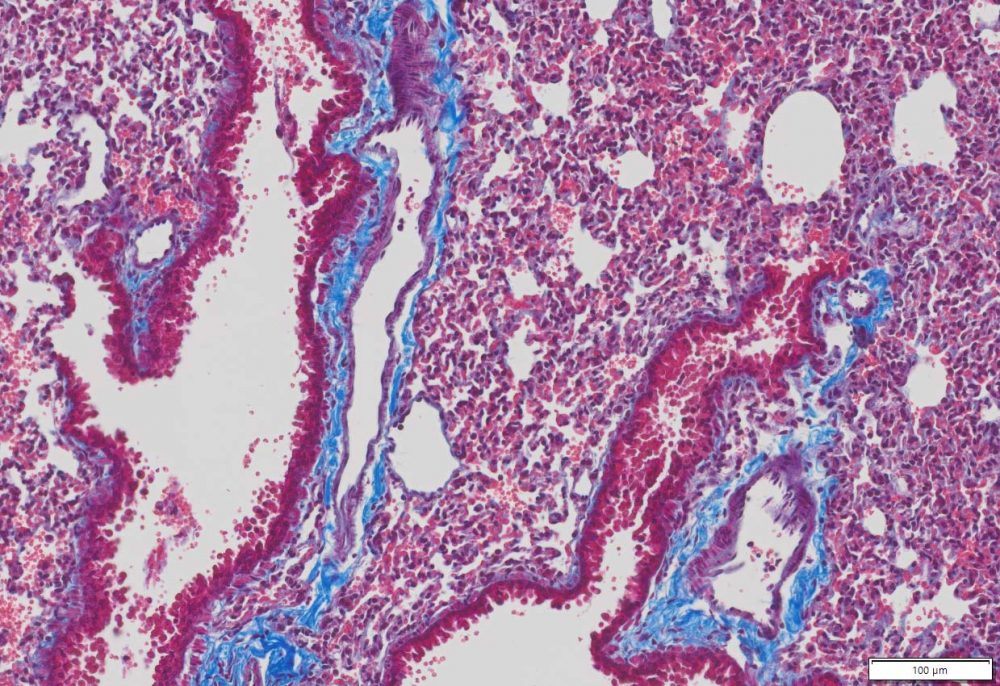
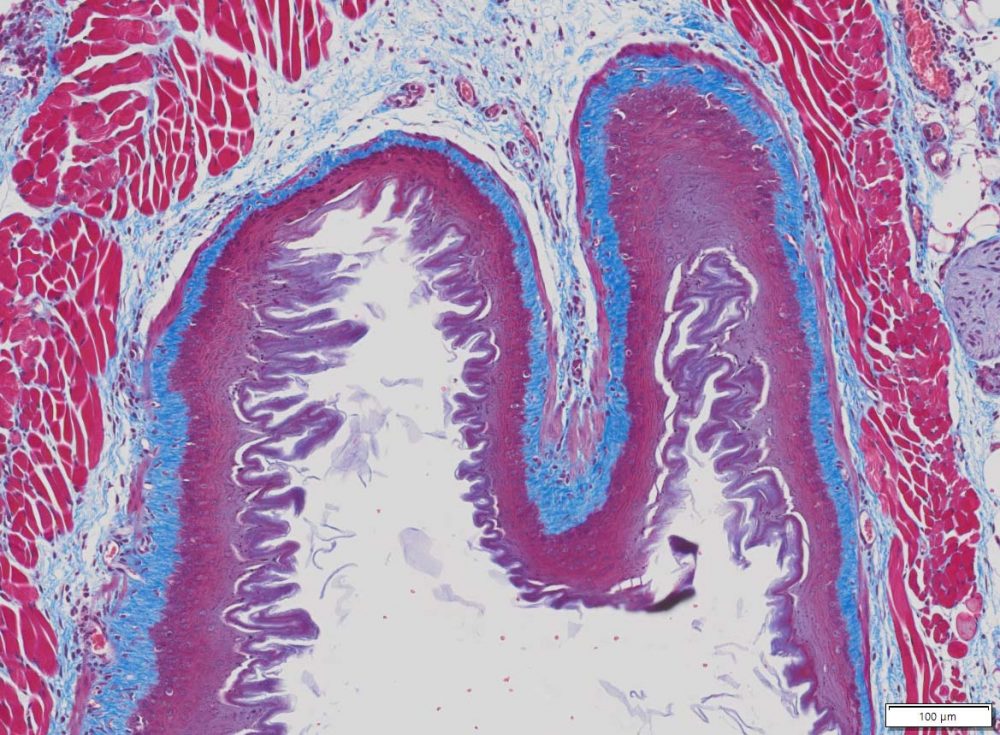
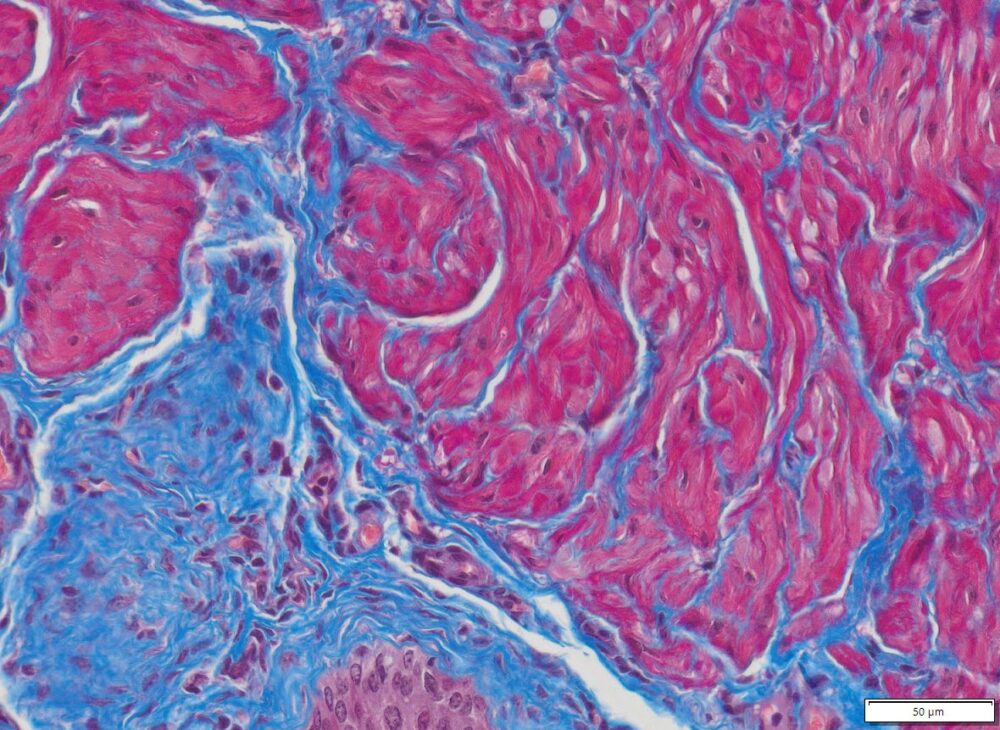
Cytoplasm, keratin, muscle fibers, Erythrocytes ——— red
Nuclei ———————————————————————— black
Collagen and mucus ————————————————- blue
More Images
Masson Trichrome Staining, Rat Heart
Masson Trichrome Staining, Mouse Lung
Masson’s Trichrome Stain,Mouse Heart, 20x
Masson Trichrome Staining, Mouse Esophagus
Selected Peer-reviewed publications and preprints that have cited the use of the VitroView™ Masson’s Trichrome Stain Kit (VB‑3016) kit
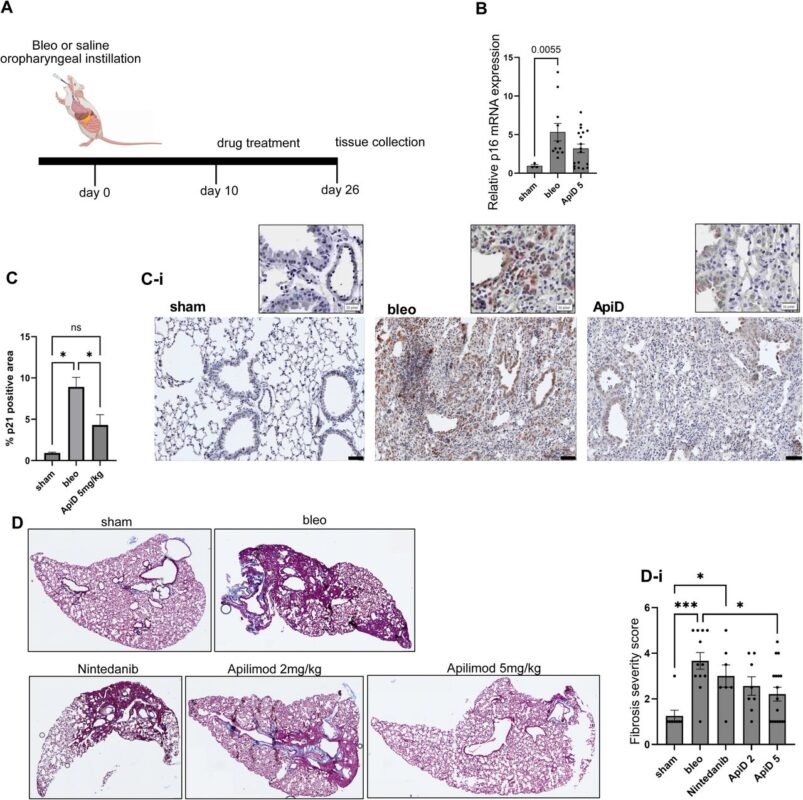
Figure 5.Apilimod decreases pulmonary fibrosis and reduces senescent cell burden in tissue A. Schematic timeline of IPF mouse experiments. Drug treatment was initiated on day ten after bleo instillation. Tissue collection was done on day 26. Created with Biorender. B.Relative CDKN2A (p16) gene expression in the left lung tissue normalized to the expression in sham group. One-way ANOVA. Mice that did not lose any weight (≥100%) after bleo instillation were excluded from analysis. C, C-i. IHC staining and quantification of the p21 signal intensity in sham-treated, bleo-treated control, and ApiD-treated mouse lungs. Quantification of all included samples (C), One-way ANOVA, *p < 0.05. Representative images of the stained tissues (C-i). Scale bar = 50 μm. D. Representative images of the Masson-trichrome-stained mouse lungs collected from sham and bleo-treated animals that received either saline (bleo), or nintedanib, or ApiD (either 2 or 5 mg/kg). D-i. Fibrosis intensity scoring in all included samples. One-way ANOVA, *p < 0.05, ***p < 0.001; n≥7.
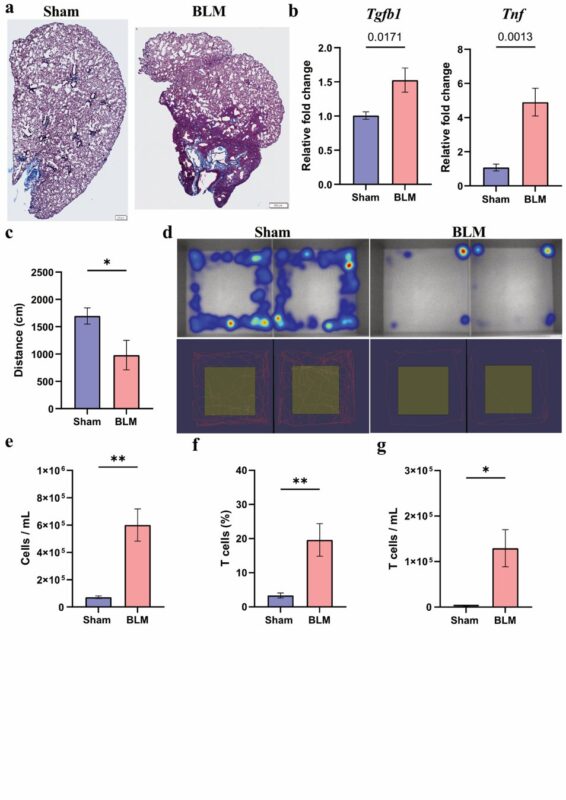
Supplementary Figure 7. Characterization of the BLM-induced fibrosis model (a) Collagen deposition in the lungs of mice treated with BLM, trichrome Masson staining. (b) Gene expression of Tgfb1 and Tnf. RNA was isolated from the right lobes. Gapdh was used as housekeeping control. (c) Total distance (in cm) moved by sham-treated and BLM-treated mice 21 days after treatment. Spontaneous movement was measured for 10 minutes using the EthoVision platform. (d) Representative images of spontaneous movement of sham-treated and BLM-treated mice 21 days after treatment. On the top, movement heatmap; red areas represent more time spent in an area compared to blue. Top represents only periphery movement. On the bottom, total distance traveled by a given mouse. (e) Total cells per mL collected in the BAL in the sham-treated and BLM-treated mice 21 days after treatment. Singlets were used as cell readouts. (f, g) T cells are recruited after fibrotic insult. The (f) percentage and (g) number of the total mouse T cells was quantified by quantifying CD3+ cells from the size, singlets, and CD3+ gate in the BAL cells.
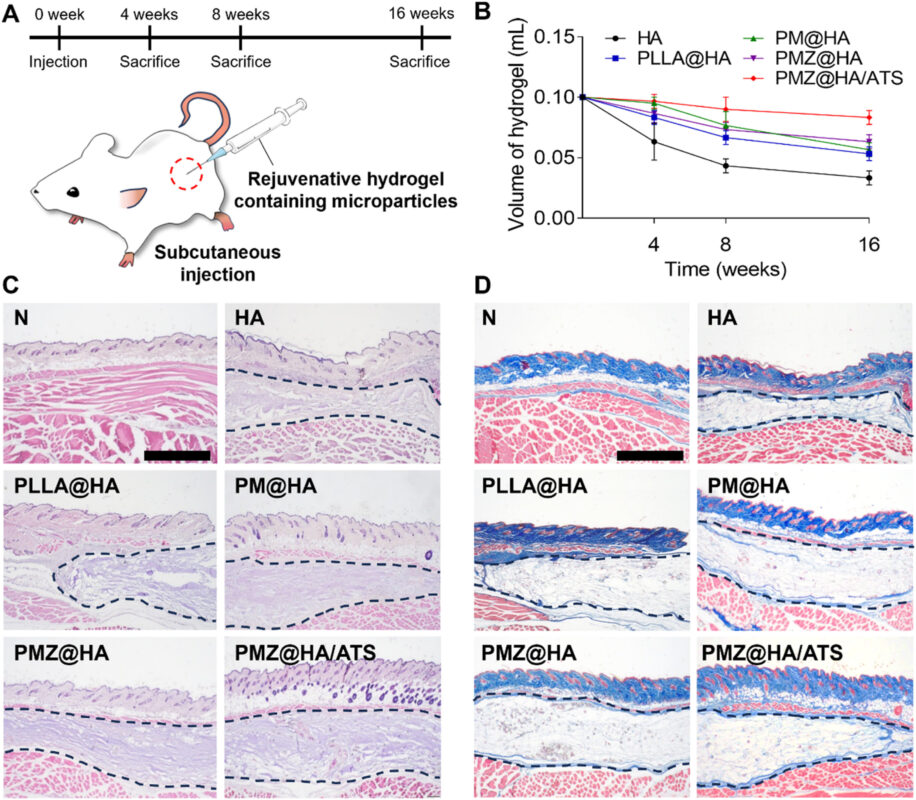
Fig. 6. Histological assessment after subcutaneous injection of rejuvenative hydrogels containing functional microparticles into mice. (A) Schematic illustrations of the in vivo experimental images. (B) Quantitative residual volumes of hydrogel at 4, 8, and 16 weeks. (C) Hematoxylin and Eosin (H&E) staining and (D) Masson’s Trichrome (MT) staining images of the dermal tissues at 16 weeks (scale bar: 1 mm).
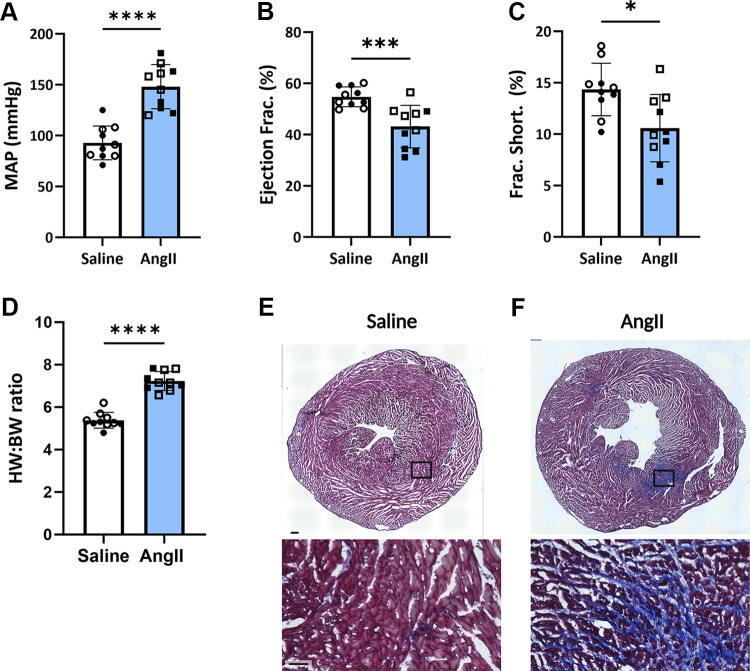
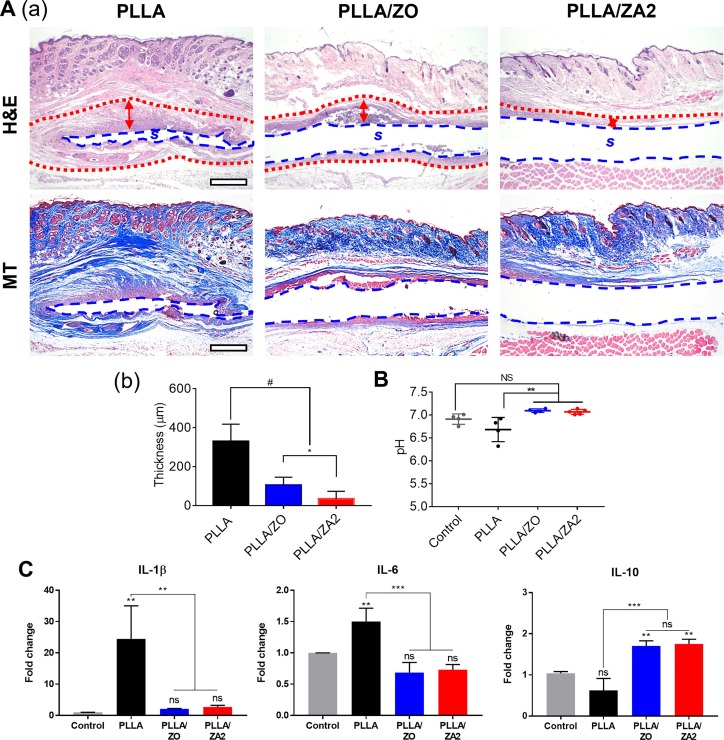
Figure 2: Angiotensin II (ANG II) treatment leads to hypertension and heart failure. Mean arterial pressure (MAP) is significantly increased (A), whereas ejection fraction (EF; B) and fractional shortening (FS; C) are decreased significantly after ANG II treatment. Data are means ± SD; n = 10 saline (5 M, 5 F), 10 ANG II (5 M, 5 F) mice, unpaired t test: MAP, ****P < 0.0001; EF, ***P < 0.001; FS, *P < 0.05. D: ANG II-treated mice display cardiac hypertrophy as shown by increased heart weight:body weight ratio. Data are means ± SD; n = 10 saline (4 M, 6 F), n = 10 ANG II (4 M, 6 F) mice, unpaired t test, and ****P < 0.0001. E and F: ANG II-treated hearts show fibrosis as demonstrated by trichrome staining. Representative images of saline- and ANG II-treated hearts stained with trichrome to show cardiac fibrosis.Fig. 7. In vivo anti-inflammatory effect of the scaffolds after 4 weeks subcutaneous implantation. (A) Histological evaluation with H&E (S: scaffold, red dash: fibrosis wall) and MT staining (a). And quantification of the fibrosis wall thickness (b). (B) pH values at implanting site. (C) Relative mRNA expressions related to pro- and anti-inflammation: IL-1β, IL-6 and IL-10. *p< 0.05, **p< 0.01, ***p < 0.001, and #p < 0.0001 indicate statistically significant differences, respectively. (For interpretation of the references to colour in this figure legend, the reader is referred to the web version of this article.)
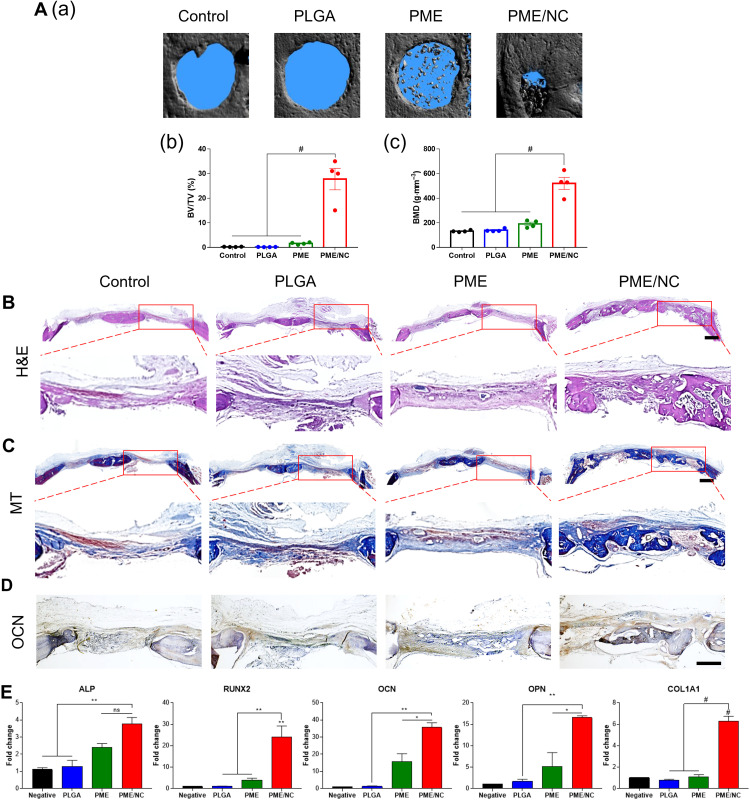
Fig. 7. New bone formation after 8 weeks of implantation in vivo. (A) Representative 3D constructed images of a superficial view of the calvarial defect using micro-CT (a). Quantified parameters of repaired bone, including (b) bone volume density (BV/TV) and (c) bone mineral density. Histological analysis with (B) H&E, (C) MT, and (D) IHC analyses of antiosteocalcin after 8 weeks of implantation. Scale bars, 1000 and 500 μm. (E) Gene expressions related to osteogenesis: ALP, RUNX2, OCN, OPN, and COL1A1. #P < 0.0001, ***P < 0.001, **P < 0.01, and *P < 0.05 indicate a statistically significant difference, respectively.
Note: This Trichrome Stain Kit is intended for research purposes only. This product is not intended to be used for therapeutic or diagnostic purposes in humans or animals.
Precautions: Handle with care. Avoid contact with eyes, skin and clothing. Do not ingest. Wear gloves.
Related products
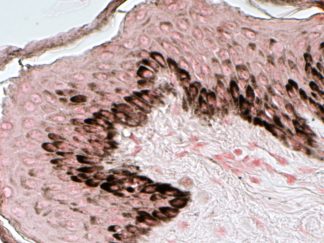
VitroView™ Fontana-Masson Stain Kit
SKU: VB-3020Sale!$343.85Original price was: $343.85.$309.46Current price is: $309.46.
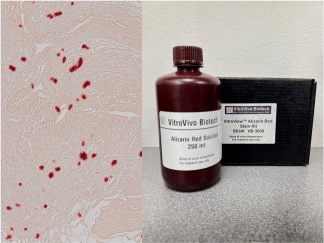
VitroView™ Alizarin Red Stain Kit
SKU: VB-3008Sale!$109.25Original price was: $109.25.$98.32Current price is: $98.32.
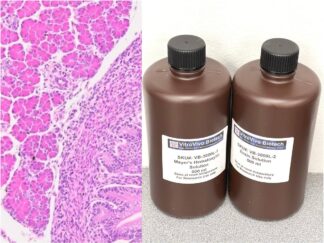
VitroView™ Hematoxylin and Eosin Stain Kit (500 ml per bottle)
SKU: VB-3000LSale!$171.35Original price was: $171.35.$154.21Current price is: $154.21.